

In some ways, 2020 is what technologists in 1995 assumed the world would look like in 2000. At the beginning of the dot-com boom in the early 1990s, the vision was that the internet would create a world where you could work from anywhere, buy everything online, and do most of your socialisation online instead of in person.
But fast forward to, say, 2019, and that vision hadn’t really played out at least not to its full potential. Physical offices were packed, and if your company was based in Chicago, you probably had to live in Chicago. Grocery stores were packed. Airlines had their best year ever as business travel was in record demand. Then 2020 hit.
In April, Microsoft CEO Satya Nadella said, “We’ve seen two years’ worth of digital transformation in two months.”
When technology was nice to have, companies embraced it warmly. When it was essential to survival, they bet the farm on it virtually overnight. A lot of the history of innovation works that way. The biggest innovations rarely occur when everyone’s happy and safe, or when the future looks bright. They happen when people are a little panicked and worried, and when the consequences of not acting quickly are too painful to bear.
This has been seen this year and beyond due to the large increases in the stock market. Specifically the S&P 500 and the Nasdaq with returns over 15%.
Technical Analysis:
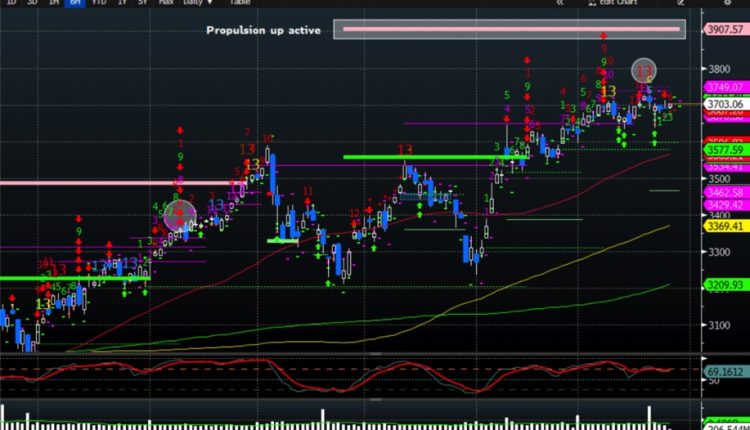
S&P 500 recently posted a Demark 13 seq sell signal circled at the top. Therefore implying a large sell off is likely to incur. Furthermore the red line at the bottom is the Commodity Chanel Index which indicates whether a stock is overbought or oversold. In this case the stock market is leading to highly overbought. As we can see the last time a Demark 13 sell signal was printed has resulted in a sharp decline in the stock market which can be seen in the middle of September.
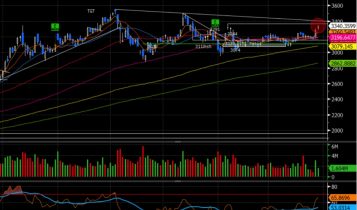
Technical analysis:
The Nasdaq’s technical set-up is very similar to that of the S&P 500, the Commodity Channel index has soared to 91.377 indicating a large overbought level in the market. Furthermore it is likely to post a Demark 9 sell level indicating a potential sell off in the market.
Company Analysis:
Amazon: Fundamental analysis
Ticker: $AMZN
Amazon as everybody knows it is the worlds largest e-commerce platform. The numbers recently reported by Amazon in their Q4 earnings are kind of mind-blowing, really. From Black Friday to Cyber Monday, third-party sellers on Amazon’s site had over $4.8 billion in revenue, which is an increase of more than 60% from 2019. The company says that works out to an average of 9,500 products sold per minute.
That’s just the retail part of the tech giant’s business. On top of that, we have Amazon Web Services, the recurring-revenue Prime subscription business, music and video streaming, Alexa popping up seemingly everywhere, and an increasingly sophisticated and impressive logistics and distribution network tying it all together. And if that isn’t enough for you, Amazon’s advertising revenue grew more than 50% year over year in the third quarter to $5.4 billion.
Fundamental analysis:
Amazon is currently approaching a big resistance level of around $3400, if it is able to take out this resistance level we could see a huge ride in the Amazon stock as we have seen over the year rising close to 100%. Amazon is a fan of the month of January as seen below.
Above is a record of Amazon’s monthly returns for the past 5 years, as we can see above January is by far the most favourable month for Amazon resulting in an almost 10% average return for the month. Could this mean that we are likely to break the $3400 resistance level as shown in the graph on the previous page.
This report is not investment advice. It is only intended to introduce the company mentioned above.
Disclaimer
All information in this report is assumed to be accurate to the best of our ability. Tikenomics.com excludes all liability, to the maximum extent permitted by law, for any inaccuracies in the Content or for the consequences of your reliance on the Content. Investors should consider this report as only a single factor when making an investment decision.