
AbbVie (ABBV) is a research-based biopharmaceutical company that was spun off from Abbott Laboratories (ABT) a number of years ago. Its blockbuster drug Humira brought in billions.
We reviewed the charts of ABBV on Dec. 7 and wrote that „The bulls are back in charge with ABBV. Prices are pointed higher. Trade ABBV from the long side risking to $114. The $133 area is our first price target.“ Our second target of $162 was reached the other day.
Let’s check the charts once again.
In the daily bar chart of ABBV, below, we can see that the shares have been in a strong rally since September. Prices are above the rising 50-day moving average line as well as the rising 200-day line. The trading volume has been more active since September than before September. The On-Balance-Volume (OBV) line shows a rise the past 12 months telling us that buyers of ABBV have been more aggressive than sellers.
The Moving Average Convergence Divergence (MACD) oscillator is pointed up but it has narrowed and could cross to the downside for a take profit sell signal.
In the weekly Japanese candlestick chart of ABBV, below, we can see a bullish longer-term picture. Prices are in an uptrend above the positively sloped 40-week moving average line. The recent weekly candles have small real bodies indicating a balance between bulls and bears and thus we need to be on alert for a possible top reversal. The uptrend could be refreshed with a strong white real body but we need to keep our eyes open.
The weekly OBV line is bullish and so is the weekly MACD oscillator.

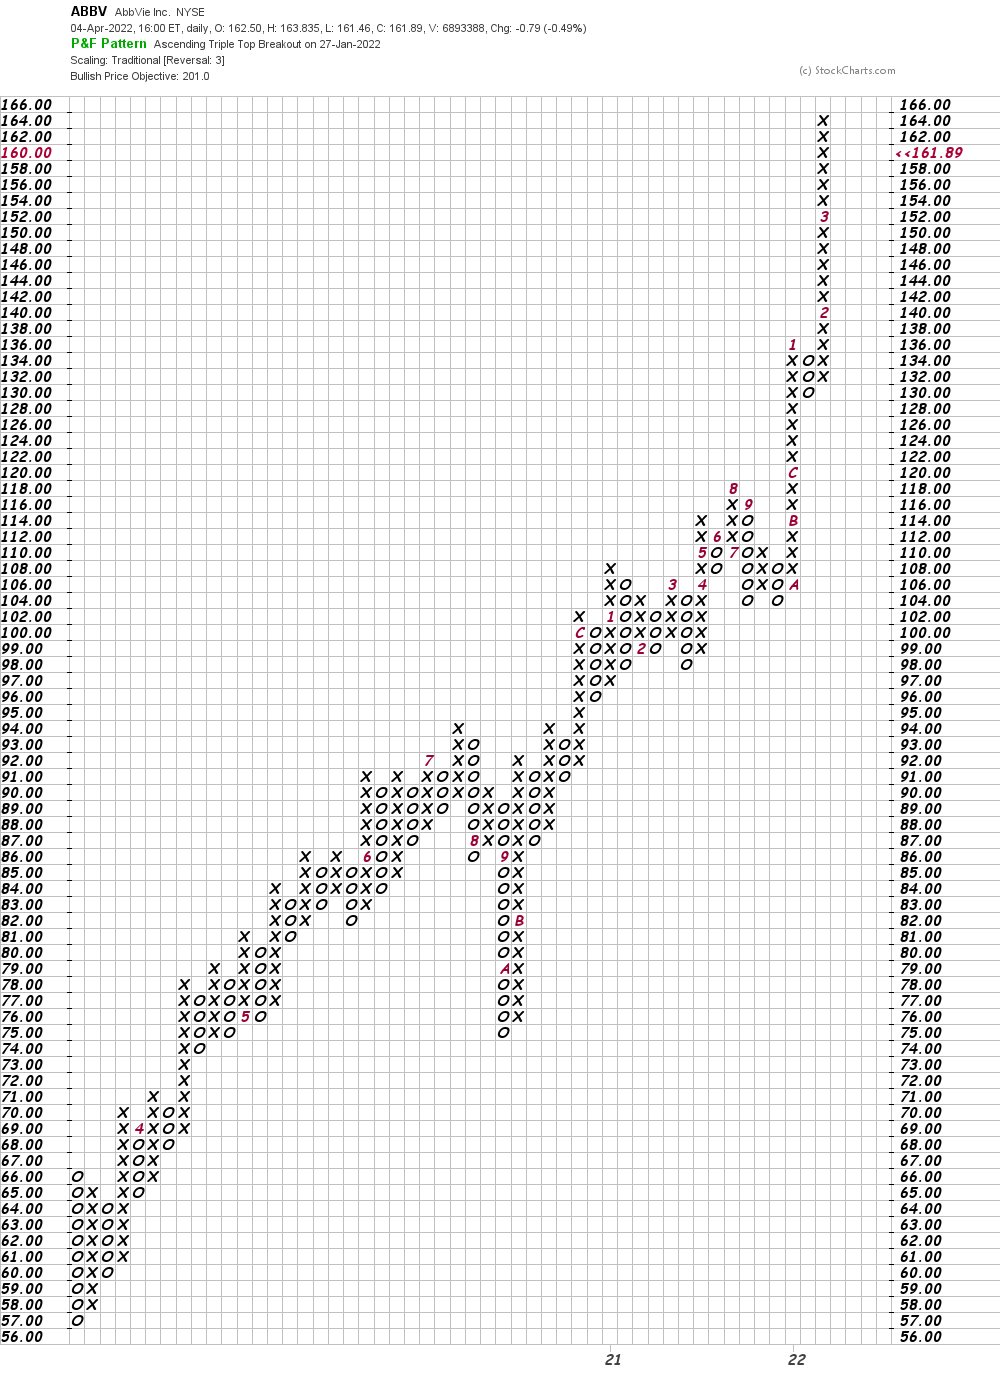
In this daily Point and Figure chart of ABBV, below, we can see a new upside price target in the $201 area.
In this weekly Point and Figure chart of ABBV, below, we can see an impressive price target of $285.

Bottom-line strategy: Overall the charts of ABBV remain bullish. I have just two concerns — one, the recent weekly candles are spinning tops and could be part of a reversal pattern. Prices might turn sideways rather than down but we just need to be aware. Second, I suspect that April will be a down month for the broader market averages and it could drag ABBV lower. Traders who are long ABBV should raise sell stops to $146 from $114. The $201 area is our next and newest price target.
Get an email alert each time I write an article for Real Money. Click the „+Follow“ next to my byline to this article.
[ad_2]
Source